Services companies are simple to understand. They recruit and train employees and contract them out to customers at a premium at around a 40% gross margin for a well-run operation. There is little upfront capital required and therefore no need for debt; services companies are commonly run with or close to net cash balance sheets. Investment is mostly expensed asides from a small amount of capex on PPE (offices, laptops etc.), which means they have the ideal balance sheet, meaning very little balance sheet at all.
The data referenced in this report is from company reports unless stated otherwise. This is not investment advice. Please do your own due diligence.
Thanks for reading! Subscribe for free to receive new posts and support my work.
High barriers to scale: while anyone can setup a services business, it is difficult breaking into customers that services businesses want to work with: Fortune 1000+ with big IT budgets (or international peers of equivalent scale). It’s harder to break into a new customer than it is to scale with an existing customer due to trust, therefore the playbook is focused on land and expand. Getting into these customers as an upstart is difficult; customer relationship is everything and it is challenging to prove to, for example, JPMorgan that you can deliver equivalent value (based on quality and breadth of service for a given price) versus, for example, Tata Consultancy Services. The vendor selection process is rigorous and considers financial health, scale, customer referrals, management and industry experience, technology competence, level of partnership with technology vendors (Google Cloud, Azure, AWS, Nvidia etc.) amongst other criteria. While barrier to entry is low, barrier to scale is high, although not insurmountable. Once the vendor is hired, the relationship is sticky and revenue is often recurring in nature – 75% of EXL’s revenue base is recurring – although vendor consolidation is always a risk.
The industry is long-duration in nature: corporates will always need support to select, implement, and operate the latest technologies to stay competitive. New technology often drives efficiency and reduces headcount, so process outsourcers must be willing to cannibalise their own services to evolve with these changes. This createsa defining feature of the industry: pricing pressure. BPOs typically commit contractually to 3–5% annual efficiency gains, reflecting automation-driven self-cannibalisation. While clients often emphasise the need for a long-term partner, vendors face continuous pressure to reduce prices. Historically, this hasn’t hindered revenue growth, as BPOs are decoupling revenue from headcount by moving from ‘butts-on-seats’ to outcomes-based contracts (see Part I), but it remains an ongoing reality that vendors must navigate and be prepared to ‘disrupt themselves’. Not all are willing to do it.
How this translates into economic value: well-run companies earn a return on capital comfortably above their cost of capital through-cycle, and compound free cash flow approximately in line with revenue growth. Use of excess free cash flow differs by company. The BPOs mostly allocate excess cash to share buybacks and bolt-on acquisitions, but pay limited dividends – Genpact is the only dividend payer in this group – which is at odds with their IT services peers who typically have high dividend payout ratios as well. Between the 3 BPOs, over the long run financial metrics broadly look quite similar, with the key differentiator being through-cycle revenue growth.
EXL Financial Review
Headline numbers:
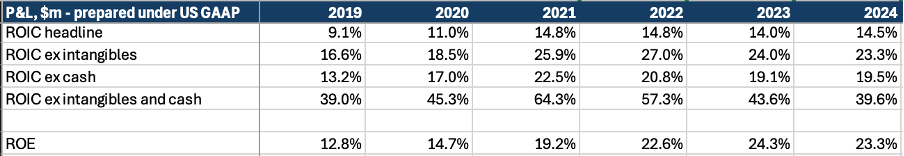
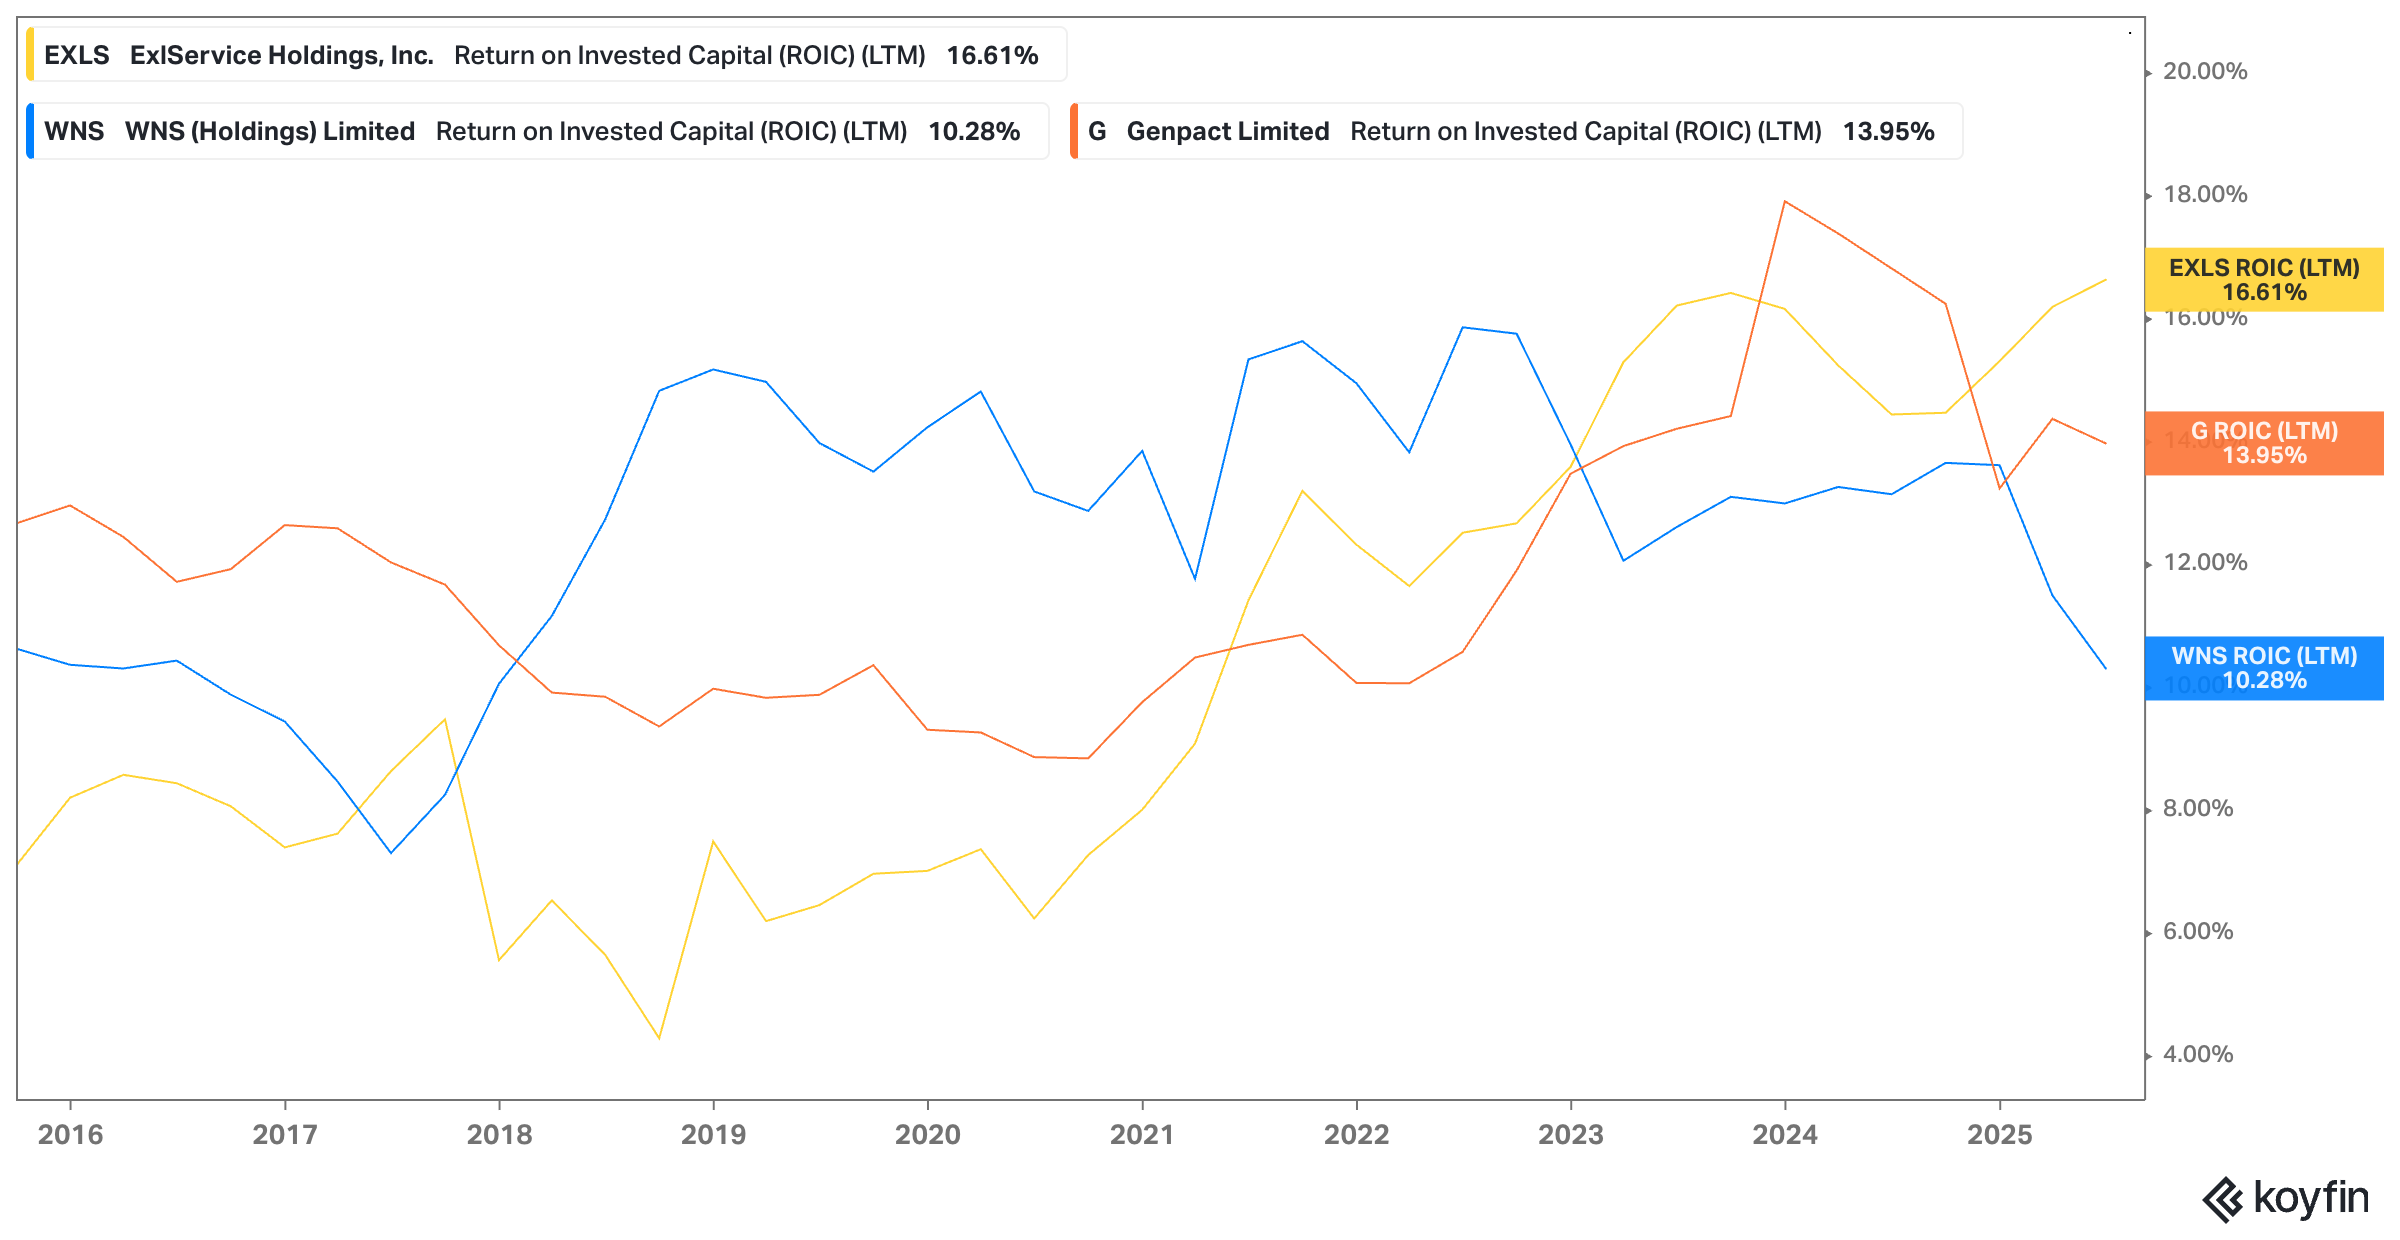
ROIC:
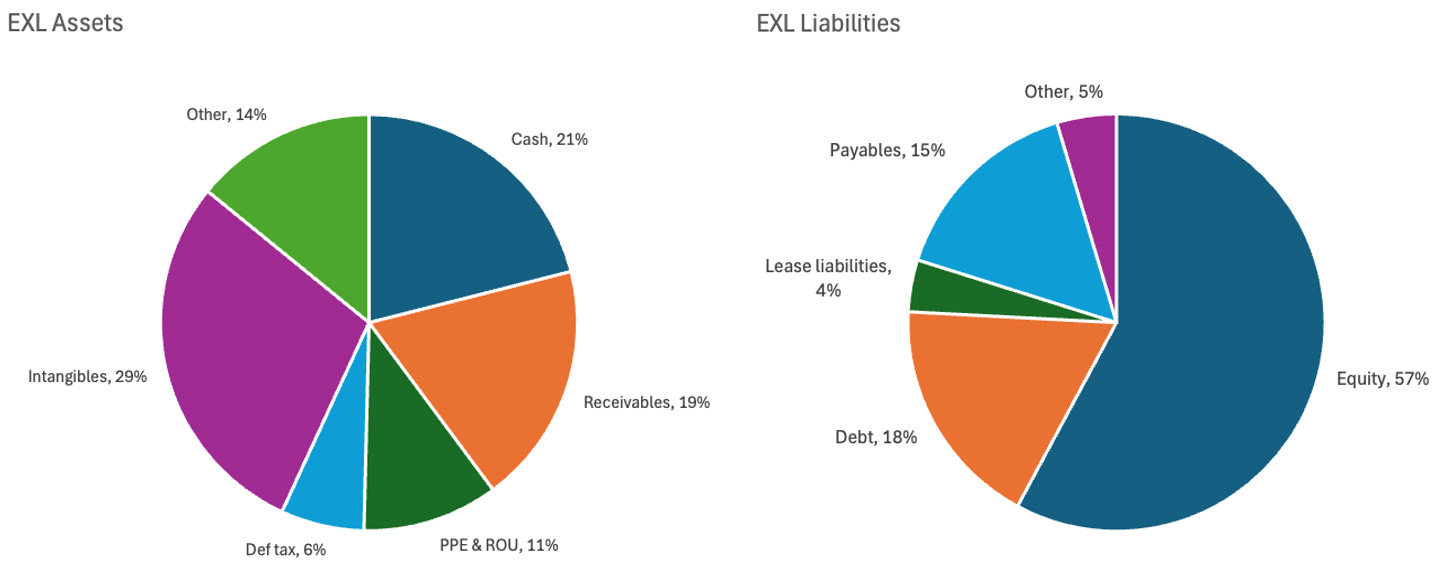
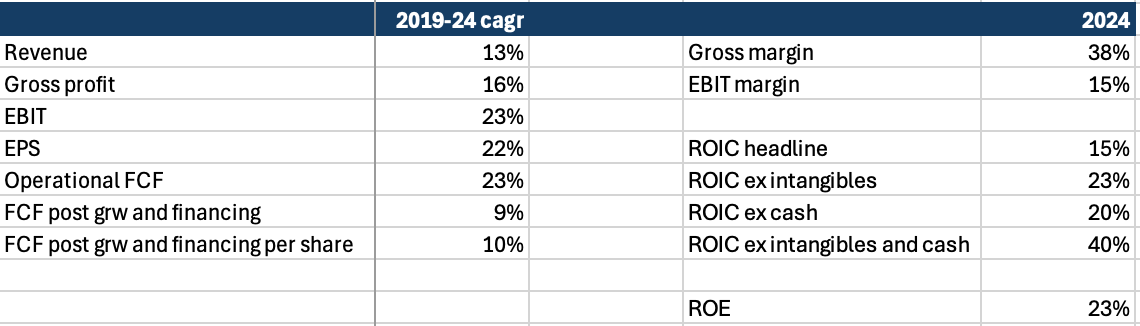
EXL has delivered a marked improvement in returns since 2019, despite the recent industry slowdown. This should partly be credited to the CFO, who joined in 2020 and embedded return metrics more deeply into decision-making, particularly around M&A. Cash and goodwill are both typically about 20-25% of assets as EXL has a semi-regular cadence of bolt-on capability-based acquisitions and typically runs the balance sheet with cash covering the small amount of debt it employs resulting in net debt/EBITDA of 0x (including leases). NOPAT is deducted for stock-based compensation, restructuring and impairment expenses (for detailed accounting explanations of ROIC see Global Spirits: Part III appendix). Operationally – before capital allocation activities – this is an efficient business, earning around a 40% return on capital.
Free cash flow has seen good growth…but understated?
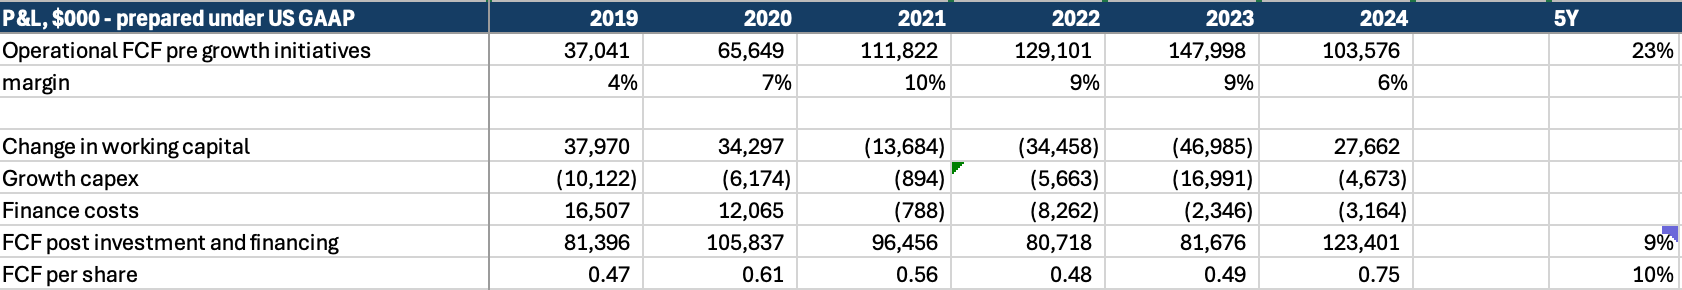
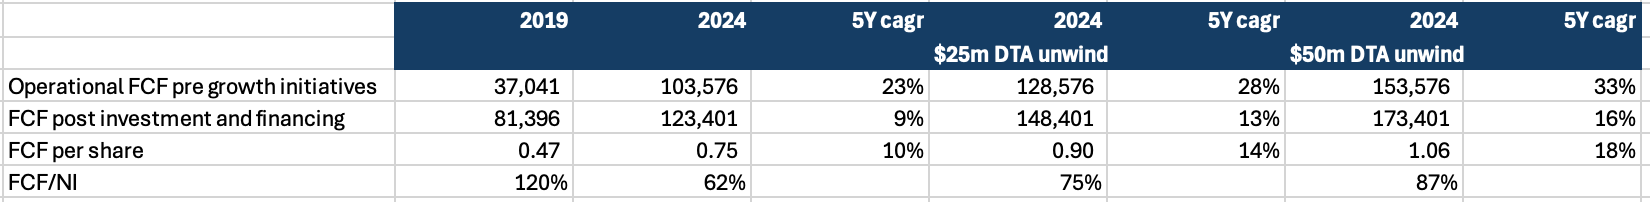
Operational free cash flow (maintenance capex but before considering growth initiatives and financing expenses) has seen solid growth of 23% per annum over the past 5 years – significantly ahead of revenue at 13%. This is mostly driven by operating margin expansion of 5 percentage points – a performance unlikely to be repeated – while importantly marketing investment has increased by 80bps. Fully baked free cash flow growth is lower due to the phasing of working capital.
However, there is a also deferred tax asset (DTA) that has hindered cash generation and that could unwind…
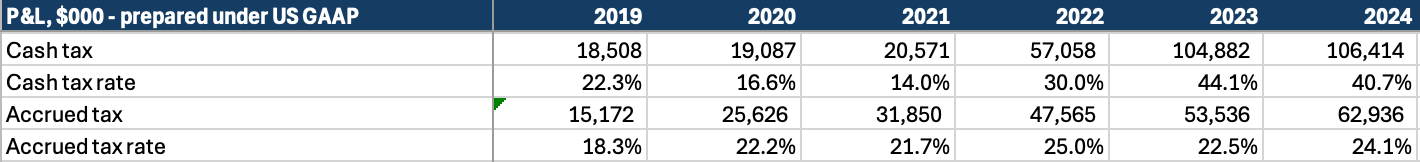
The degradation in FCF conversion (FCF/NI) since 2022 is notable, and the absolute conversion in recent years lower than it should be for this business; a range of 80-10% should be expected, on average. Taking a closer look it is largely due to cash taxes being higher than accrued (or book) taxes as deferred tax assets (net of deferred tax liabilities) have grown from $11m to $103m over 5 years:
Deferred taxes are primarily a timing issue caused by a difference between accounting treatment and tax treatment of specific items, but can hinder cash growth if growth in deferred tax asset growth is unusually high – as it has been for EXL. One item dominates the movement: capitalised R&D. Of the $92m increase in net DTAs between 2019–24, about $50m relates to R&D. This reflects a change in U.S. tax law rather than any shift in EXL’s underlying R&D intensity, which has remained steady at 2–3% of sales. Under the TCJA, effective from 2022, companies could no longer deduct R&D immediately for tax purposes; instead, costs had to be capitalised and amortised over five years (domestic) or fifteen years (foreign), creating a mismatch with book treatment. In 2025, new legislation partially reversed this, reinstating immediate expensing for domestic R&D. As of 2024, roughly half of EXL’s R&D-related DTA was domestic.
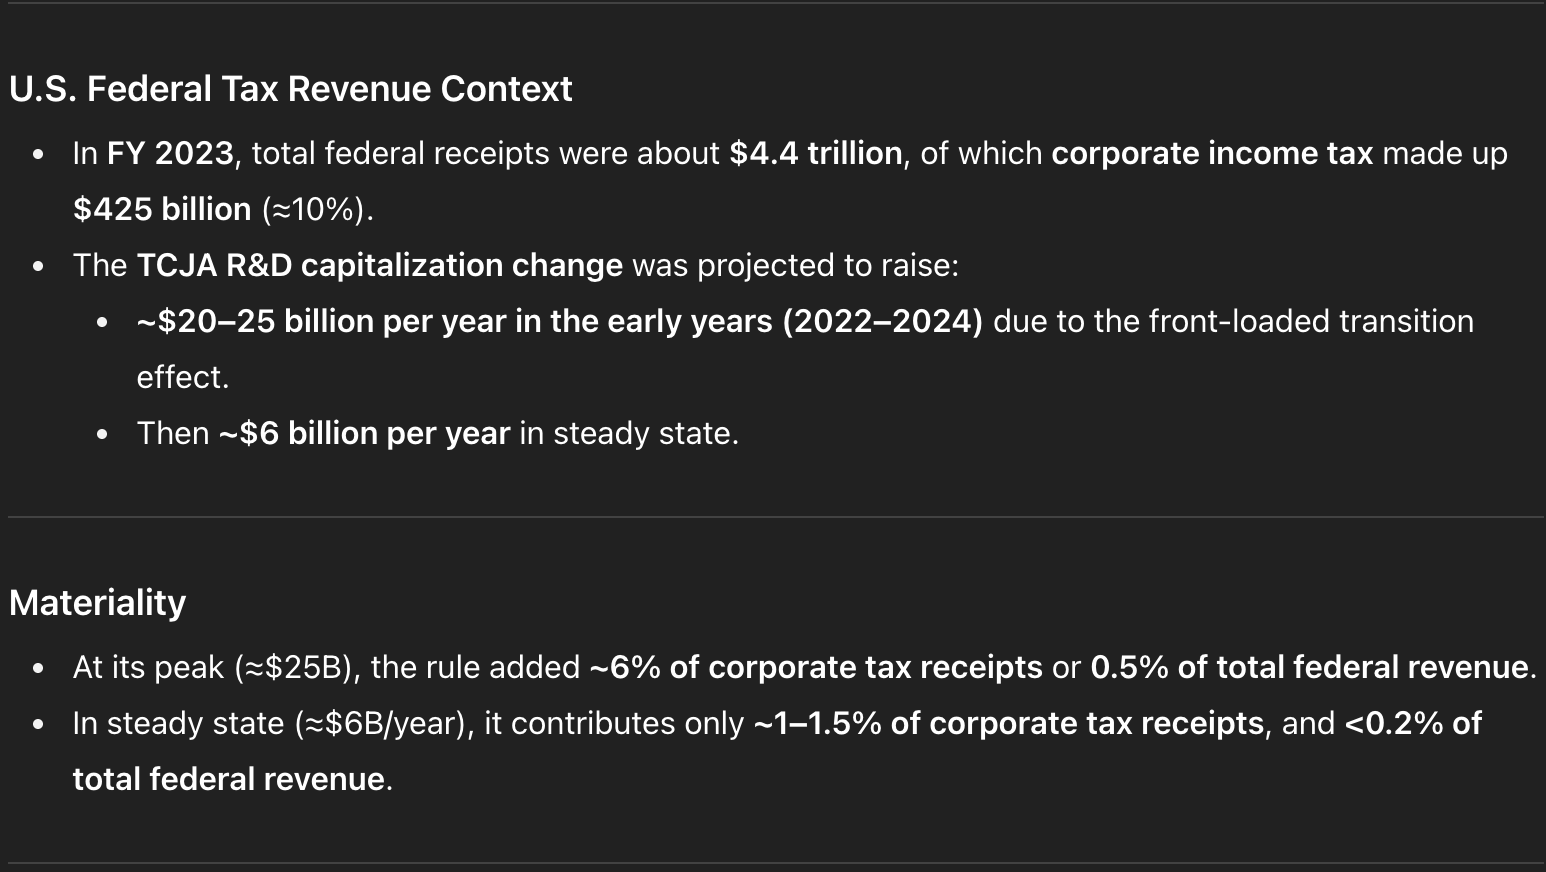
As a brief aside, I was curious about the materialality of this change on total U.S. corporate tax revenue. For disclosure I am not a tax expert and have relied entirely on ChatGPT for this analysis. Interestingly, the Biden-era tax changes suggest that this specific provision alone could account for roughly 6% of corporate tax receipts in the near term, and 1–1.5% over the longer term. Some blunt observations to ponder: (1) the U.S. deficit issue is well known, and this highlights that there are ways to raise tax revenue from corporates beyond simply increasing the headline corporate tax rate; (2) this change may act as a disincentive for U.S. companies to invest in R&D—potentially explaining the more recent policy reversal on immediate expensing of domestic R&D, meanwhile the impact on total federal revenue is relatively small; (3) could this create some near-term advantage for non-US based companies with global R&D centres versus their US peers…?
Back to EXL…
EXL’s $50m R&D-related DTA should gradually unwind: around half ($25m) relates to domestic R&D, which may reverse more quickly given the recent change allowing immediate expensing, while the balance reflects foreign R&D, which will be amortised over 15 years. Over time, as successive years of amortisation catch up with new R&D spend, the tax and book treatments will converge. Because EXL is growing, some mismatch will persist, but the big picture is that the DTA will naturally decline andthis is a temporary hit to free cash flow.
Very crudely adjusted for the DTA unwind, 2024 free cash conversion looks closer to the expected 80–100% range. Operationally, EXL has grown free cash flow more strongly than the headline numbers suggest, with optics skewed mainly by shifting tax law rather than underlying business performance.
The main concern would be whether any of this is not realisable and subject to a future write down: EXL has ring fenced a little under 2% of gross deferred tax assets under its realisability test which is fairly immaterial, but should be monitored for creep. More on this in valuation.
Use of excess free cash flow:
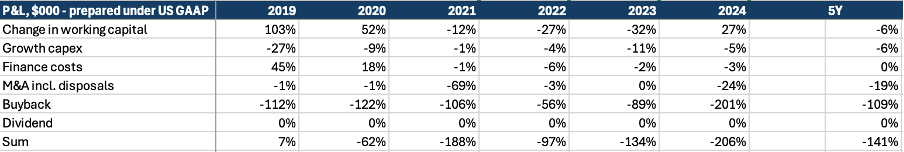
The efficiency of the business model can be seen more evidently here. Very little excess cash is needed for asset investment which leaves the company to allocate all of its cash flow to bolt-on deals and share buybacks.
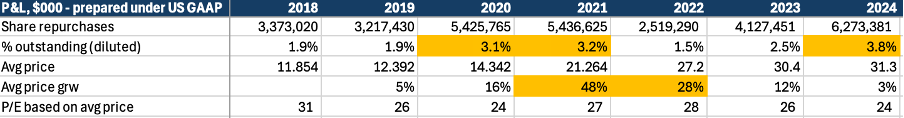
Buyback effectiveness: when the new CFO started in 2020, one of his promises was to buyback stock in excess of stock-based compensation, in order to reduce share count, and thus total share count has been reduced by 6% since 2019. The company has an ongoing regular buyback programme, but it it is good to see that it is accelerated when the stock price is weak – although from previous discussions with management there is no formula or required IRR to determine what defines a weak share price. Despite this their judgement seems reasonable based on track record. In the years following share repurchases of more than 3% of the outstanding share base, the stock price corrected positively. Although with the stock -2% year-to-date, 2025 could be an anomaly!
How Does EXL Financially Compare With Peers Genpact and WNS?
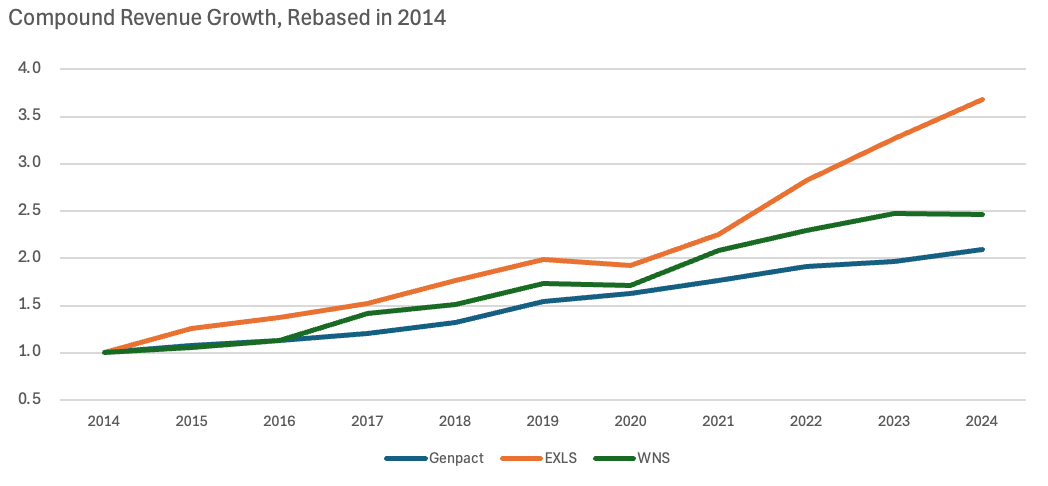
Services companies tend to look similar with regards to the potential return that can be earned. They go through their own respective cycles, but over the long-run provided they are sufficiently well managed there tends to be little sustainable difference in return on capital (they earn similar margins and have similar balance sheets). The main difference stems from the rate at which they can compound capital, where there has been a notable difference thanks to corporate strategy, as discussed in Part I, and this has driven a material difference in shareholder outcomes.
The obvious question is therefore over the future sustainability of EXL’s revenue outperformance.
EXL’s mid-term guidance is to continue growing revenue at low double-digit levels, with EPS growth slightly ahead. They have consistently delivered this in the past, and most shareholders likely own the stock expecting LDD revenue growth over the next 5 years. How will it sustain this?
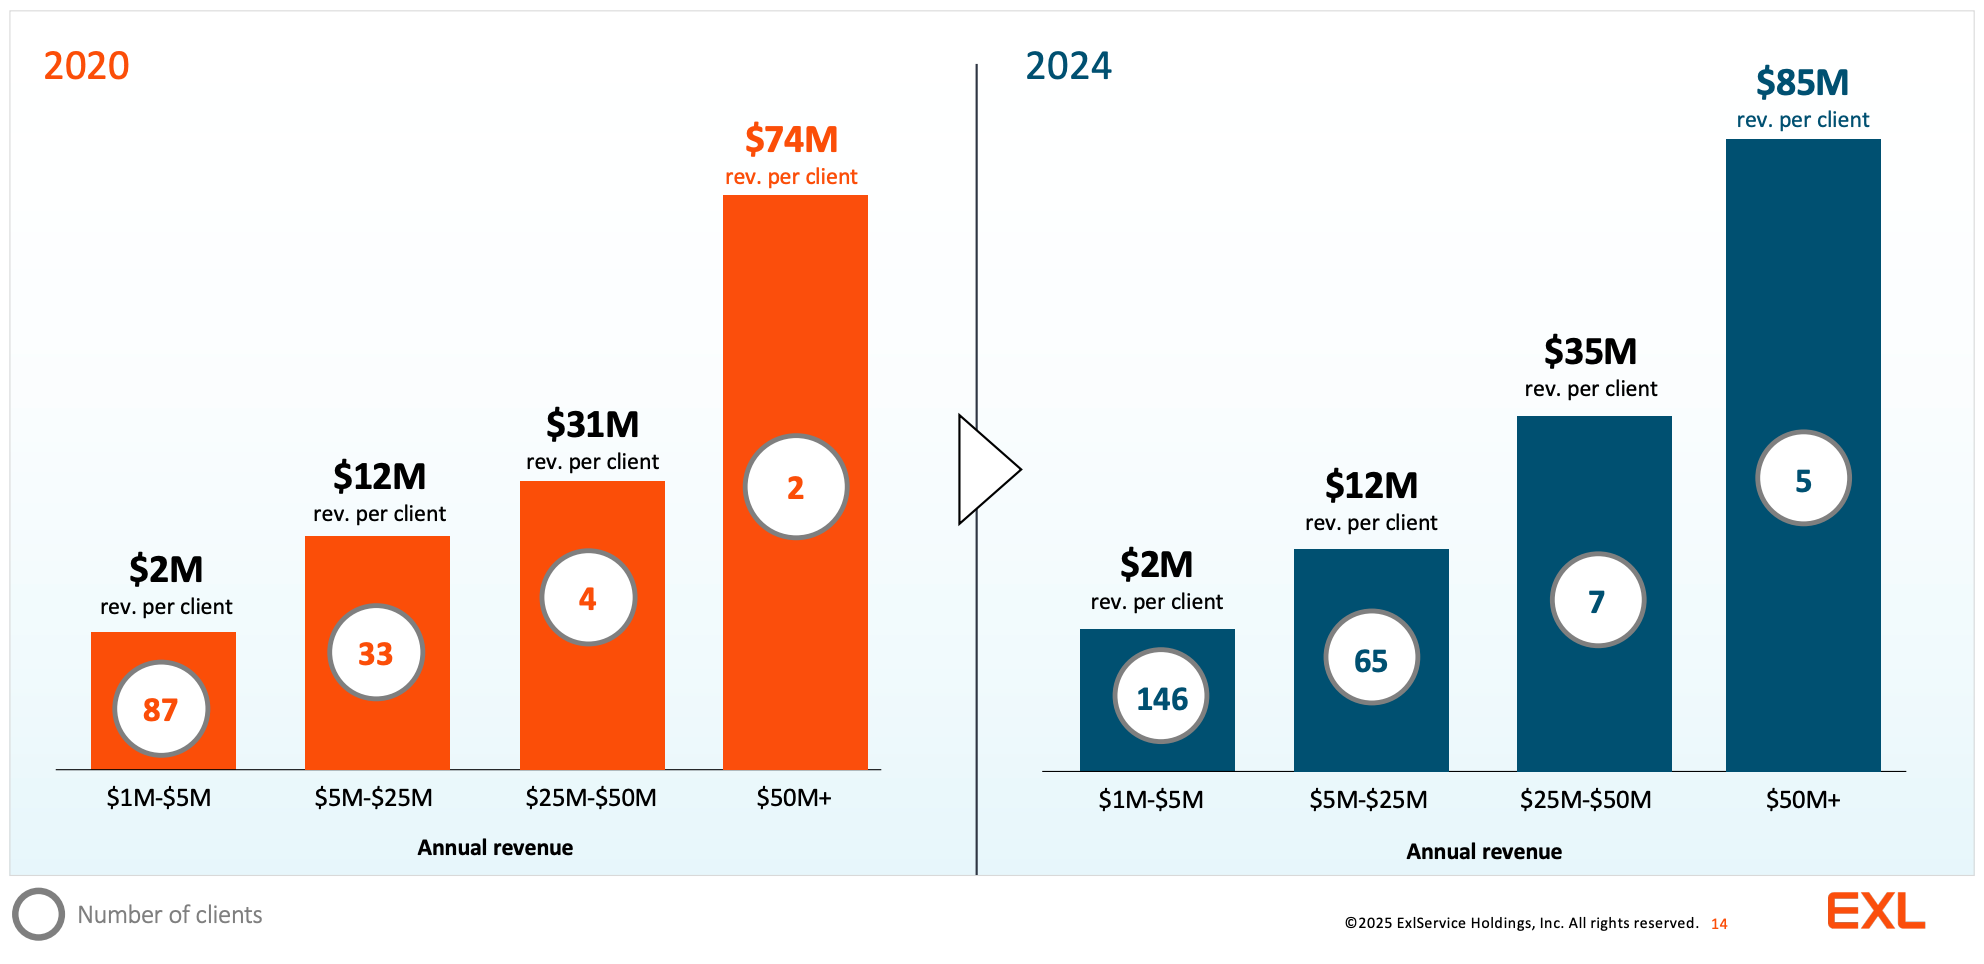
Land and expand: EXL’s legacy is in the insurance segment, and already works with 9 out of 10 of the top US insurers, crucially it needs to keep winning business within these clients. The second part of the growth story is success with new clients in other verticals, where it is already proving itself. It is well established in the Healthcare space, working with 6/10 of the top health care payers, and is seeing good traction in banking and retail sectors, although the latter are more nascent. It also plans to grow more outside of North America, which is currently 85% of revenue. Below shows success in both ‘land’ and ‘expand’:
Supported by up-skilling: EXL has notably improved revenue/headcount 2014-19, but has seen 0% improvement since.
This is an important part of the revenue formula, as it represents the up-skilling of employees and/or the decoupling of revenue from headcount as services move towards outcomes-based and away from transactional. This is important because as more technology is implemented into operations and headcount needed to deliver each process decreases, earning revenue based on a process outcome rather than ‘butts on seats’ will ensure the headwind to EXL’s revenue growth does not become unmanageable. It has stagnated recently, likely due to the industry downturn, and EXL has at least held its billing rate flat, while peers’ rates have seen declines. Over the medium-term this is an important metric to monitor and ensure that it restarts its positive cadence as the market recovers.
Investment versus Genpact and WNS
There is - frustratingly - very little comparability between the 3 companies and it’s difficult to draw firm conclusions, particularly as marketing is likely the most important investment line item, where we’re missing the breakout for Genpact.
Marketing: Genpact does not break out marketing from SG&A. EXL has spent an average of 8% of sales on sales & marketing over the past 5 years, versus 6% for WNS.
R&D: only EXL’s R&D spend is available due to the breakout under the deferred tax footnote and is 2-3% of sales. Interestingly the tax issue doesn’t affect the financials of Genpact and WNS; it is unclear why. It could be the exact classification of the R&D spending (the law apparently applies only to experimental spend where EXL could be spending on on it’s data and analytics platforms), materiality, or something else entirely. The main issue is that we have no basis for comparison.
Capex: EXL and WNS both spend an average of 3.5% of sales over the past 5 years, versus 1.5% for Genpact.
Will Artificial Intelligence Takeover the Industry?
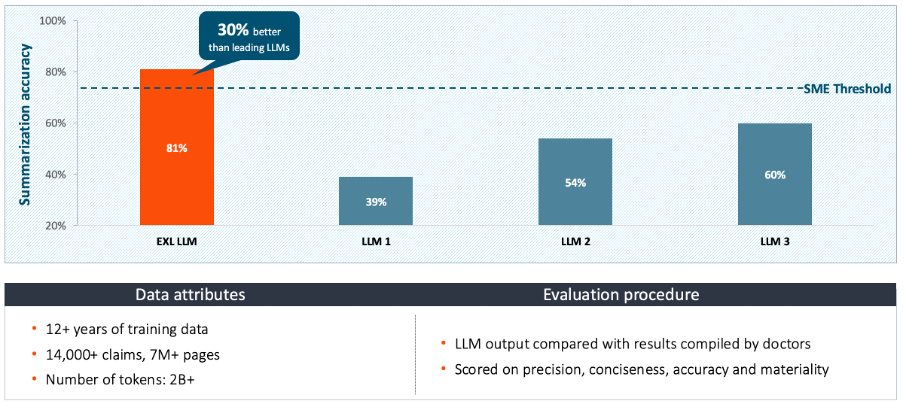
After the initial version of ChatGPT was released towards the end of 2022, the sector went through a crisis of confidence as the market debated the disruption potential from AI. The first point to note is that this is not the first time that a new technology has caused panic in the BPO industry, and is unlikely to be the last. When robotics process automation (RPA) technology started to become more mainstream with Automation Anywhere and UiPath, a similar debate ensued. The result was that the BPOs formed technology partnerships and were used as a selling channel into corporates. One important thing to understand about how lots of corporate work is that they often don’t go directly to a technology vendor to ask for the product. A large role of services vendors is to understand and test the breadth of technology offerings, which is why the partnership schemes exists (services companies are an effective sales channel for IP owners). As the go-to-market is almost always domain-led, services vendors help to bridge the gap between industry problems and technology solutions. Because of the issue with data complexities in organisations, lifting a solution directly from an IP provider without deep data and process integration means that earning an acceptable ROI generally doesn’t happen (from Part I: corporate AI deployment has a only seen a 30% success rate). Therefore the role of a company like EXL who can contextualise, integrate and reiterate the IP with the data and process seems increasingly relevant in an AI world. It is important to remember that there is already a high degree of automation in the work that the sector delivers, and it is more appropriate to think of AI as an evolution, not a revolution.
Investment Conclusion
Thesis
Founder-led EXL is a quality compounder, able to grow revenues and earnings per share at a low double-digit rate while generating 20%+ returns on operating capital - an ideal financial profile for a long term hold. Its atypically ROIC-focused CFO has driven notable improvements in the business’s return profile since joining, with ROIC now embedded as a core KPI. The economics are underpinned by average client tenure of 10 years in its insurance vertical, where EXL is a market leader, working with 9/10 of the top US companies, thanks to its focus on data, analytics, and AI solutions. Through internal development and bolt-on acquisitions, it has also built a leading position in healthcare, proving it is not a one-trick pony, while continuing to expand in retail and banking, supporting a long runway for growth. Disclosure is excellent, and all interactions suggest management is minority shareholder friendly. With these qualities, EXL comfortably earns a spot on “the list” of high-quality, long-term compounders.
Risk
EXL combines a net-cash balance sheet, capex-light model, strong through-cycle margins, and a proven track record, resulting in a relatively low-risk profile. Its largest client accounts for just 8% of sales, and a diversified client base across insurance, healthcare, and other verticals reduces concentration risk. Founder-led and publicly listed since 1999, the company benefits from additional stability. That said, risks remain: cross-border tensions with India (home to 66% of employees), technology obsolescence, reputational incidents like the 2013 Travelers data breach, and vendor consolidation. None are unique to EXL, which has been deliberately built to mitigate industry-specific risks.
Valuation
The current valuation is above what I would consider fair value. While screened numbers suggest EXL is trading at ~22x blended 1-year forward P/E, adjusting for stock-based compensation—which is modest at ~4% of sales—pushes the multiple to ~27x, with a 2025 FCF yield of just 2.2%. Even factoring in a potential reversal (unconfirmed) of the deferred tax asset for domestic R&D, FCF rises only to ~2.6%—still below my 3% threshold for a compelling entry point.
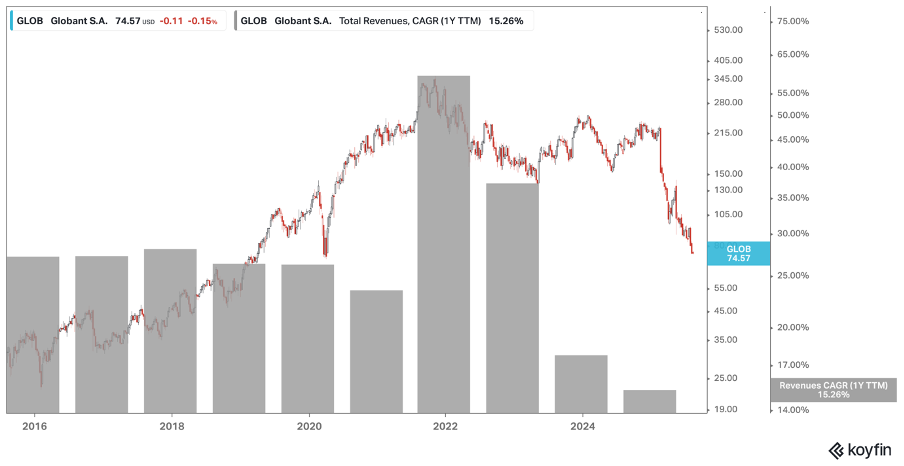
Management’s mid-term guidance (historically conservative) is for low-double-digit revenue and EPS growth, slightly below long-term trends. This makes today’s valuation appear moderately rich, and the market would likely have little tolerance for the company missing, regardless of the reason. A failure to maintain this cadence will likely trigger a de-rating, as seen recently in IT services peer Globant, which, like EXL, maintained a growth premium through the 2023/24 slowdown, only to see its multiple contract harshly as revenue growth slowed this year. While EXL is on '“the list”, it is prudent to err on the side of caution and wait for a more conservative entry point.
The data referenced in this report is from company reports unless stated otherwise. This is not investment advice. Please do your own due diligence.
Thanks for reading! Subscribe for free to receive new posts and support my work.